As Program Manager, How you measure team performance and what all Agile method you use?Provide a real scenarios with examples.
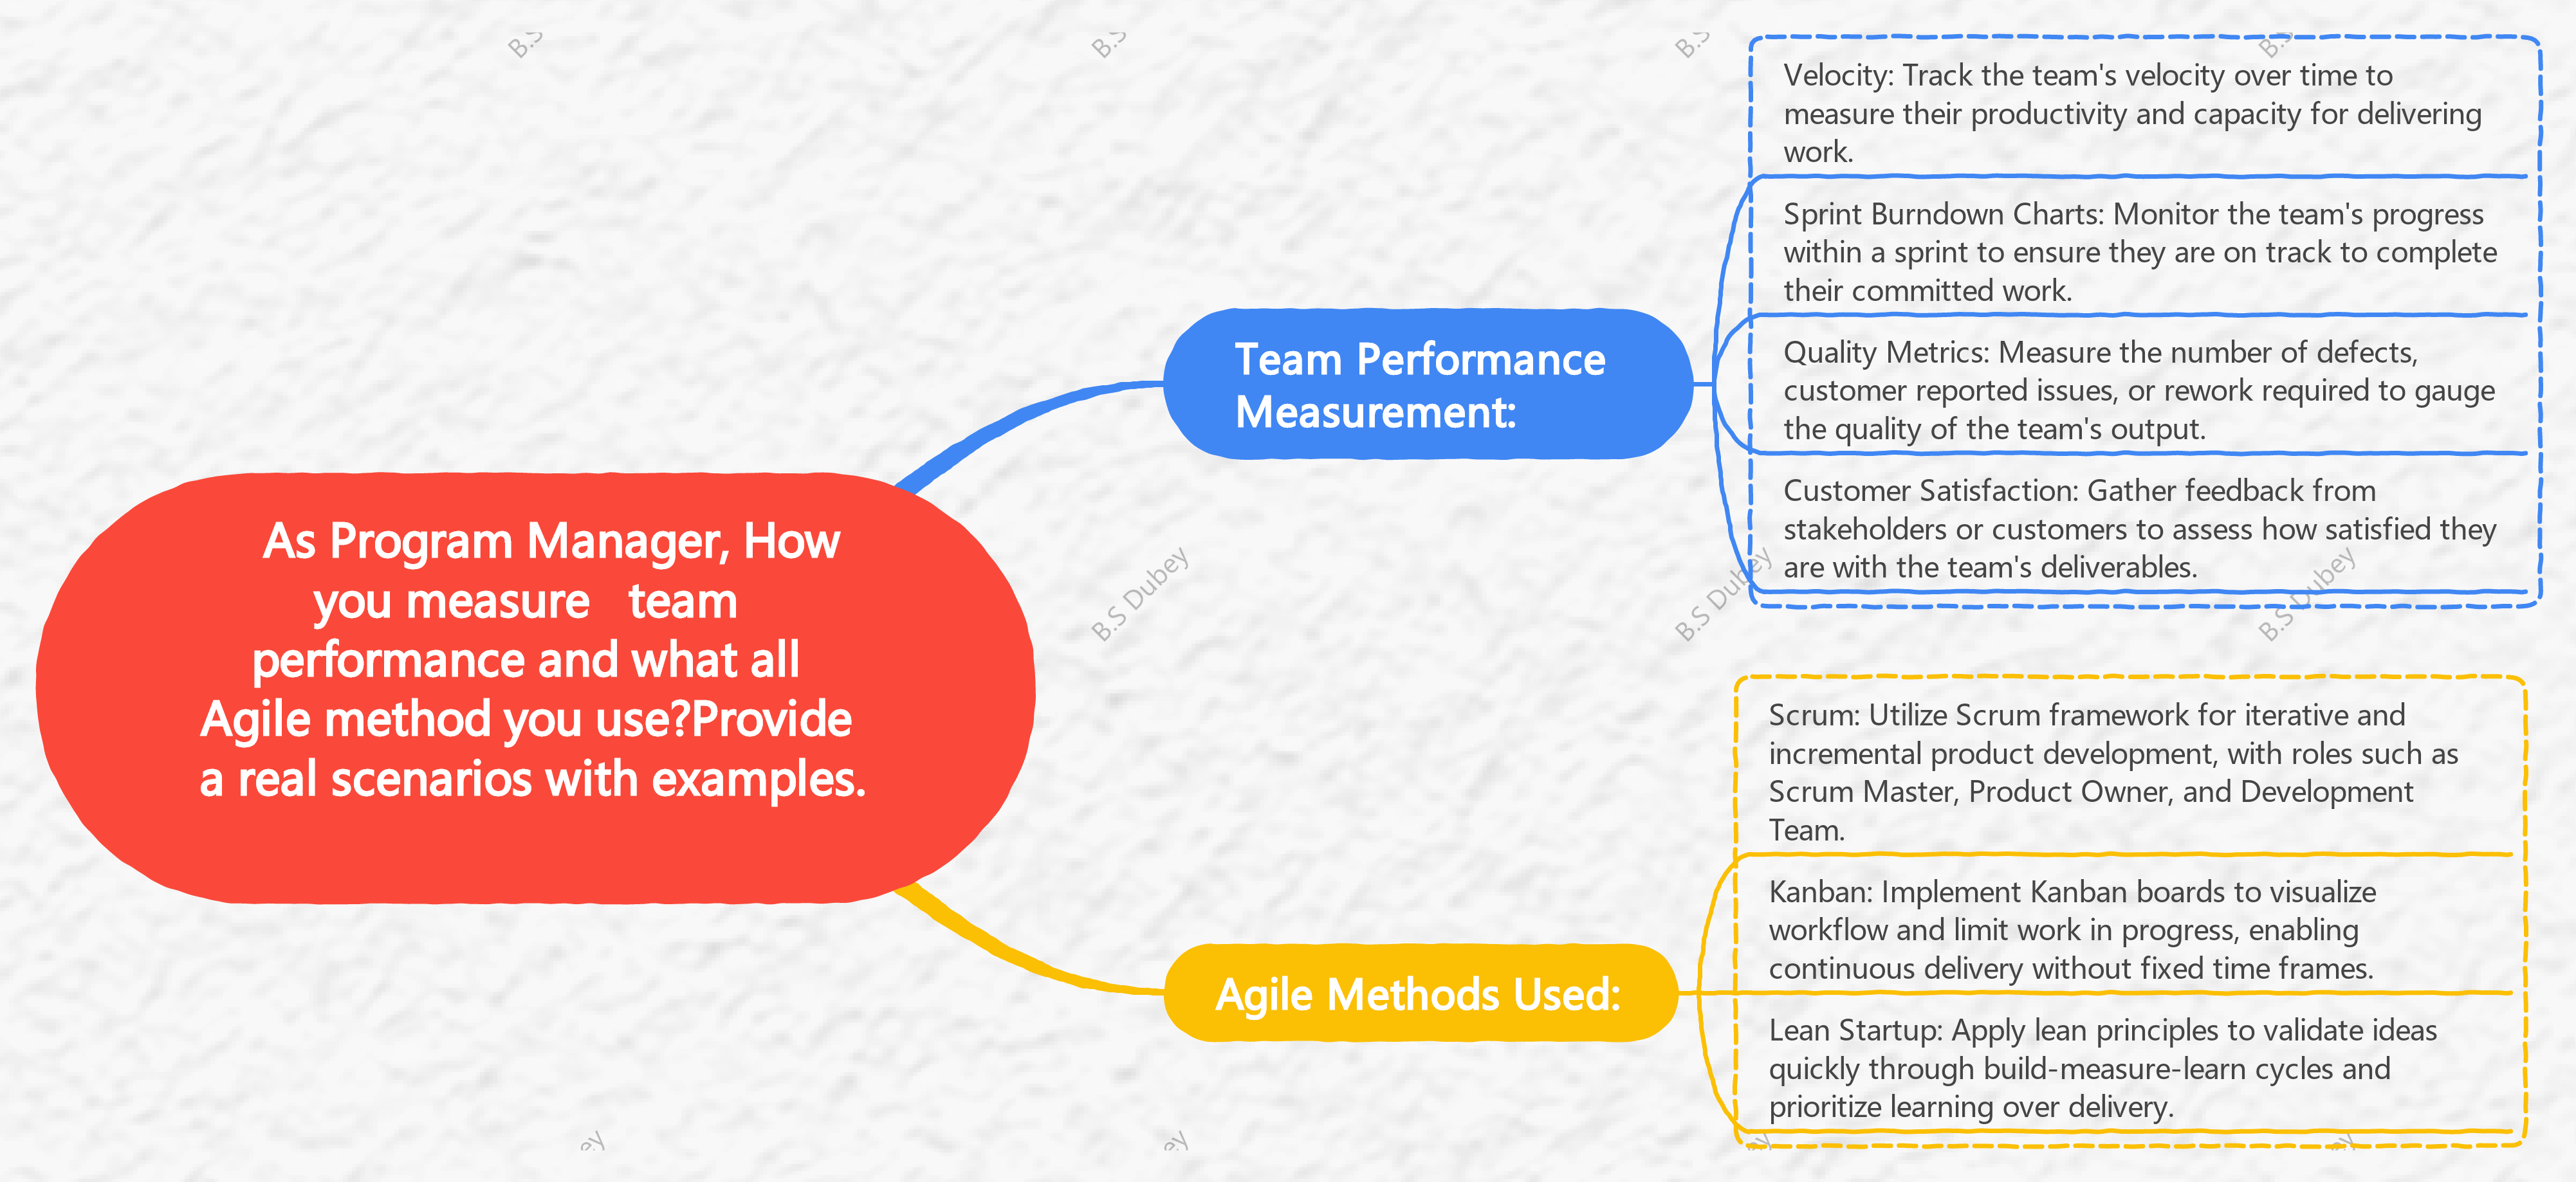
Team Performance Measurement:
Velocity: Track the team’s velocity over time to measure their productivity and capacity for delivering work.
Sprint Burndown Charts: Monitor the team’s progress within a sprint to ensure they are on track to complete their committed work.
Quality Metrics: Measure the number of defects, customer reported issues, or rework required to gauge the quality of the team’s output.
Customer Satisfaction: Gather feedback from stakeholders or customers to assess how satisfied they are with the team’s deliverables.
Agile Methods Used:
Scrum: Utilize Scrum framework for iterative and incremental product development, with roles such as Scrum Master, Product Owner, and Development Team.
Kanban: Implement Kanban boards to visualize workflow and limit work in progress, enabling continuous delivery without fixed time frames.
Lean Startup: Apply lean principles to validate ideas quickly through build-measure-learn cycles and prioritize learning over delivery.
Scenario: Development of a New Feature in a Software Application
Background:
Assume that, there are 8 people on the team: 2 front-end developers, 3 back-end developers, 1 UX designer, 1 QA engineer, and 1 Scrum Master.
Project: Adding a new feature to an app that already exists
Four sprints, with two weeks between each one.
Agile Method Used: Scrum
Daily Standups: Brief meetings to discuss progress and obstacles
Sprint Planning: Planning tasks for the sprint
Sprint Review: Reviewing work done at the end of the sprint
Sprint Retrospective: Reflecting on the sprint to improve future sprints
Metrics for Performance:
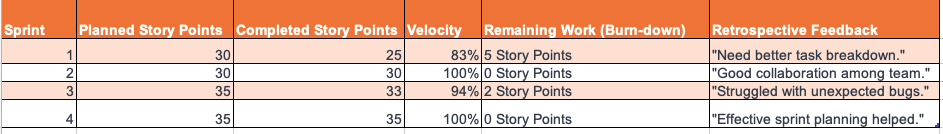
Velocity is a way to track how much work a team gets done in a sprint. It is measured in story points.
Burn-down chart: shows how much work is left in the race or day.
Sprint Retrospective Feedback: This is feedback from team members about the sprint that is qualitative.
Details on the calculations:
Finding the speed: (Completed Story Points / Planned Story Points) * 100
Sprint 1: (25/30) * 100 = 83%
Burning down The chart: To get rid of finished story points each day, start with the total number of story points.
What it means:
Sprint 1: Slower speed meant that tasks needed to be broken down better.
Sprints 2 and 4: High pace and no work left to do show that planning and execution went well.
Sprint 3: A little slower speed because of problems we didn’t expect.